Mermaid.js Diagrams in Azure DevOps Wikis
As I've been reading books this year, I've found that I've wanted to start capturing notes and thoughts about the reading I'm doing somewhere. I've begun to use Azure DevOps' Wiki functionality to write down the takeaways from my reading.
Azure DevOps has been a good tool for this purpose. There is a lot that I like about it. It is free, and I feel it has the right UX for a technical user such as myself. Wiki pages are defined as Markdown, which I'm very comfortable using. Additionally, each wiki is a git repository, which makes it very easy to track changes as time passes.

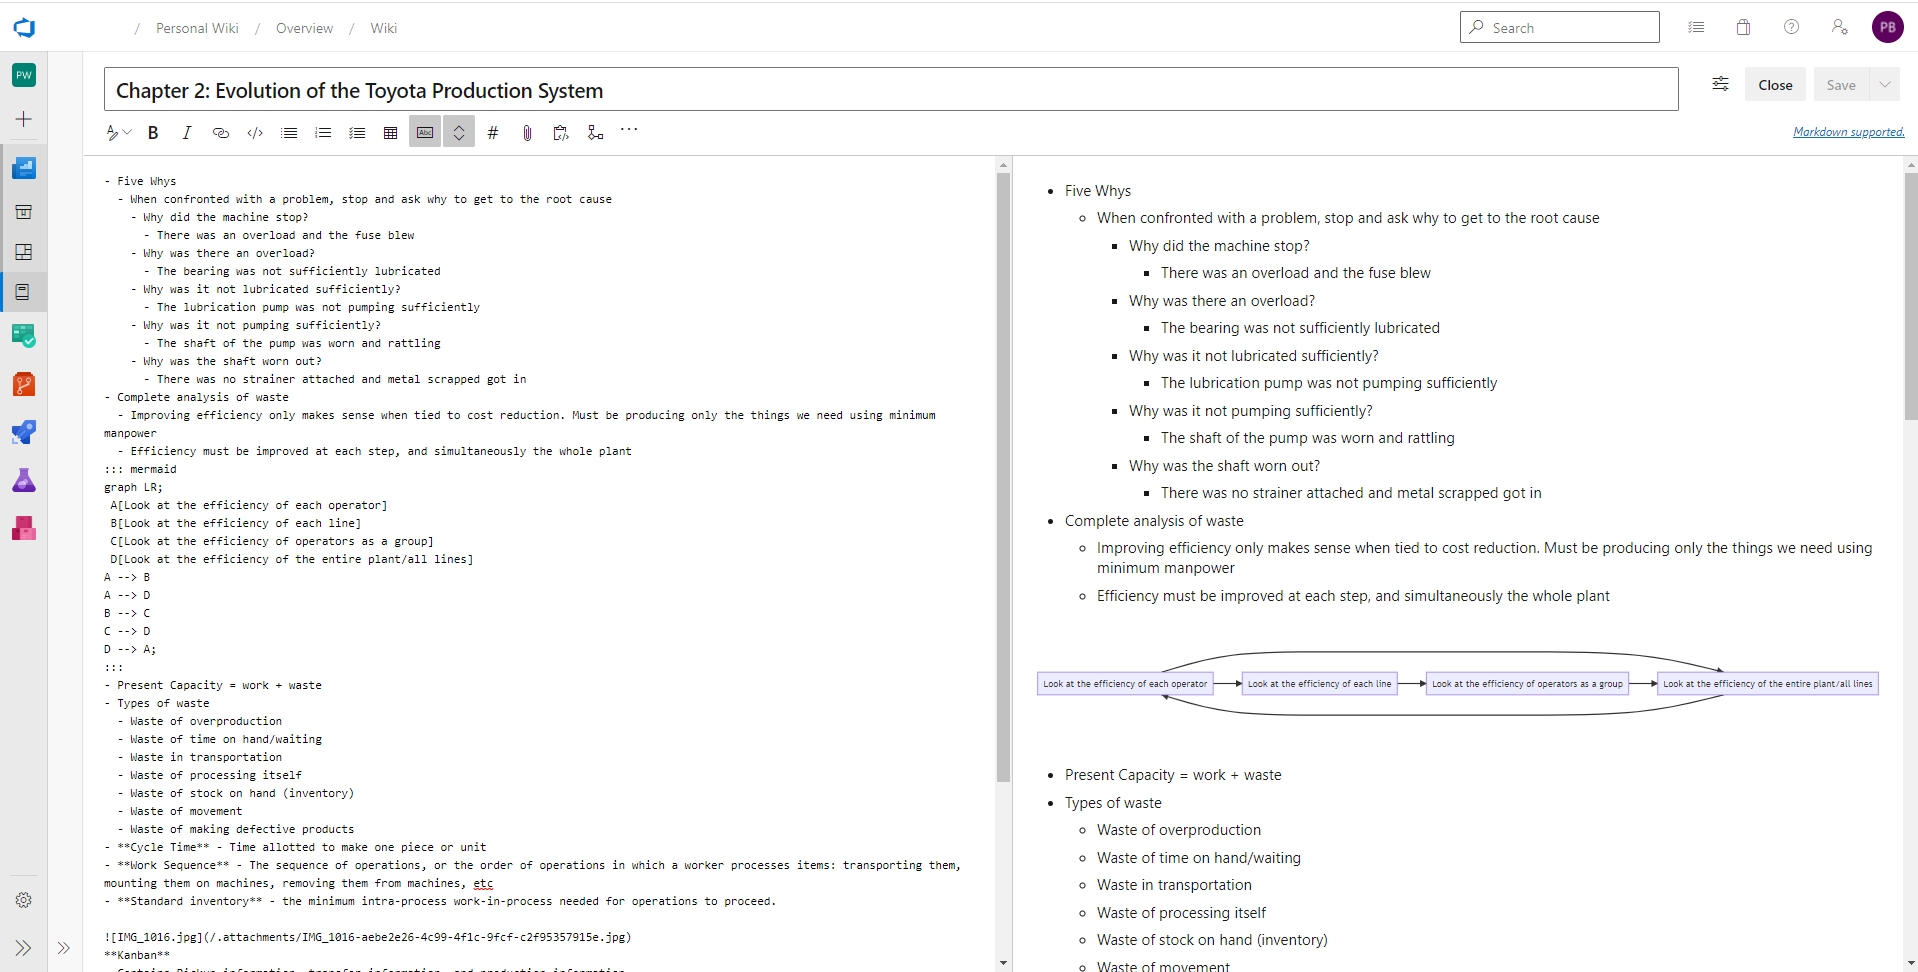
One feature I've recently discovered is flow charts powered by Mermaid. Mermaid is a markdown-style syntax to create diagrams and visualizations. A Mermaid diagram can be inserted on a wiki page simply by pressing this button in the ribbon:
This inserts the following syntax onto the wiki page:
::: mermaid
 graph LR;
 A[Wiki supports Mermaid] --> B[Visit https://mermaidjs.github.io/ for Mermaid syntax];
:::
That syntax creates the following diagram:
I find that forming a visualization is a way for me to cement my learning on a topic. I often best understand multi-step processes graphically. For example, here's the diagram I've created to help me capture my understanding of a thought process around waste elimination in a production process I read about in Taiichi Ohno's Toyota Production System:

::: mermaid
graph LR;
 A[Look at the efficiency of each operator]
 B[Look at the efficiency of each line]
 C[Look at the efficiency of operators as a group]
 D[Look at the efficiency of the entire plant/all lines]
A --> B
A --> D
B --> C
C --> D
D --> A;
:::
I have found that Azure DevOps doesn't seem to support all of the available syntax from the Mermaid.js documentation. However, what it does support is very useful. I'm going to be looking for more opportunities to explore Mermaid in the near future.
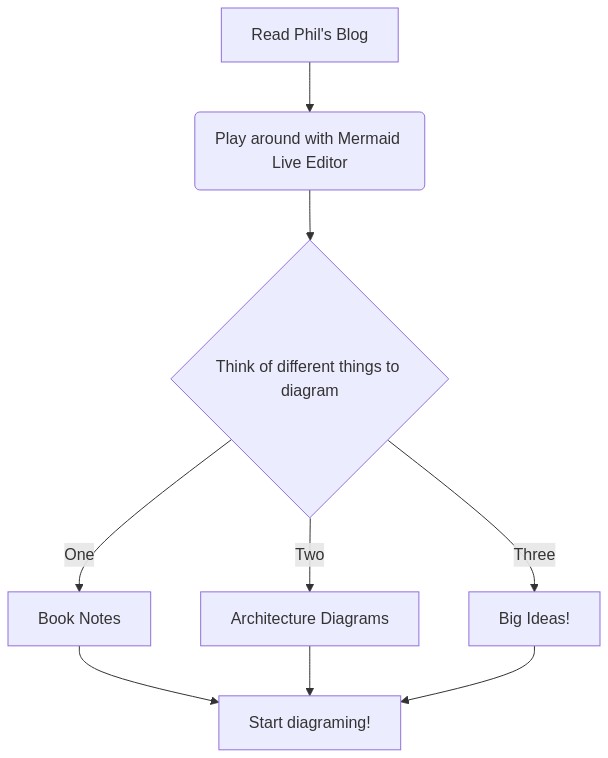
If you want to play around with the technology yourself, feel free to use the Mermaid Live Editor by clicking on the diagram below:
